Network Metadata for CX Instructions
This guide will walk through the installation and usage instructions for Prilink’s Network Metadata for CX (NMCX). This solution provides Genesys Cloud CX users with accurate metadata to monitor and trace their network traffic. We begin with a brief overview of the 4 main deployment steps, followed by detailed instructions for each step in a separate linked section below.
1. The first step is to subscribe to the NMCX Premium App from Genesys AppFoundry and run the installation wizard. This process will launch your first t-meter instance. A t-meter analyzes mirrored SIP Trunk and Internet traffic in real-time, and compiles analytics for all SIP and IP endpoints. (*Note*: SIP signalling must use unencrypted port 5060)
2. The second step is to check the status of your recently launched t-meter, and to download the t-console Windows app and login to the t-quicksight web dashboard. t-console and t-quicksight are the primary ways of accessing the network metadata compiled by the t-meter.
In steps 3 and 4, you will arrange for a copy of your network traffic to be sent to the t-meter for analysis. Step-by-step instructions for this process are provided below for an AWS environment. If you are not using AWS for your infrastructure, please see the Non-AWS section at the end of this guide.
3. The third step is to launch a VXLAN Collector in your AWS VPC. The VXLAN Collector will be responsible for creating a VXLAN tunnel to your t-meter, which will be used to forward your network traffic for analysis.
4. The fourth and final step is to setup AWS Traffic Mirroring. This will allow you to mirror your SIP and IP traffic to your VXLAN collector, which will in turn forward the traffic to a t-meter for analysis.
Step by Step Instructions:
- Installing the NMCX Premium App from AppFoundry
- Accessing Network Metadata for CX
- Launching a VXLAN Collector in AWS
- Setting up AWS Traffic Mirroring
1. Installing the NMCX Premium App from AppFoundry
To be able to add a Premium Client Application in your Genesys Cloud org, make sure that you have the Billing > Subscription > Add permission assigned to your Role.
The following are the steps to install the Network Metadata for CX (NMCX) Premium App:
-
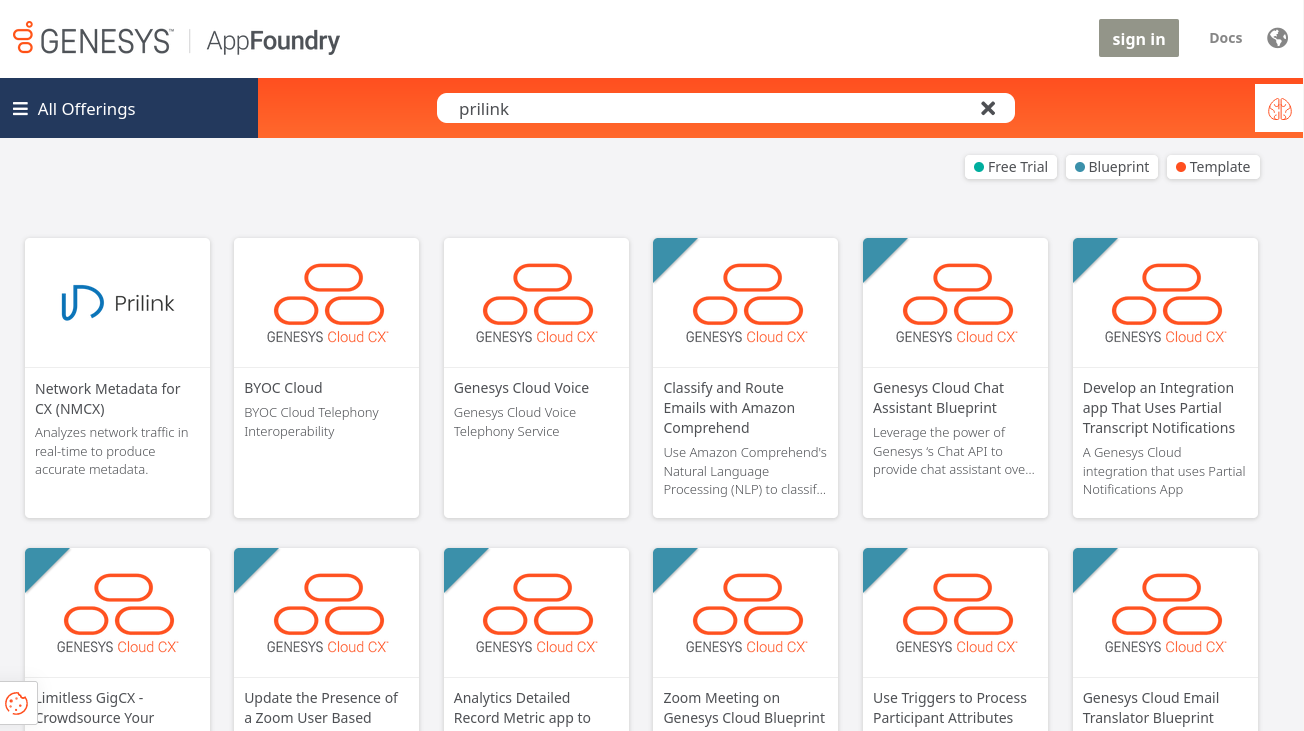
Go to the AppFoundry site and sign in. On the search bar, type
prilink and choose the Network Metadata for CX card and follow the
on-screen instructions.
-
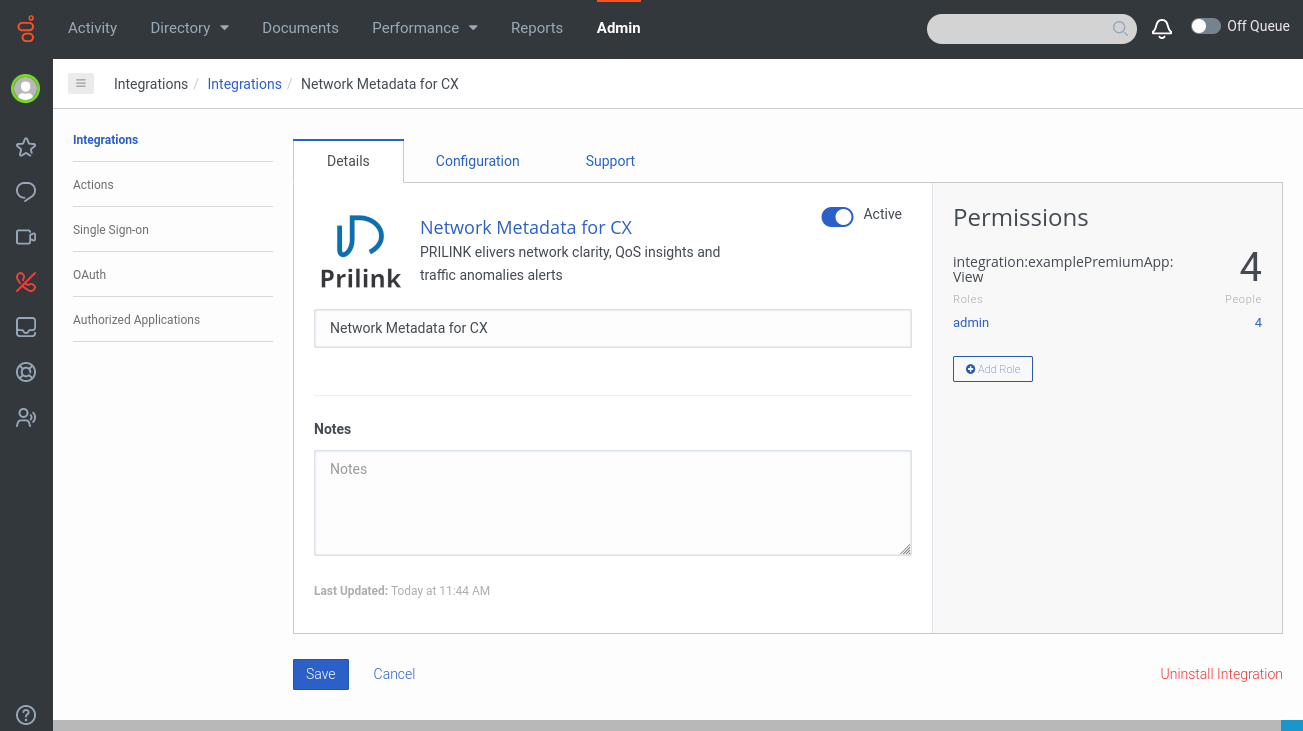
Once the NMCX App has been added to your Genesys Cloud organization, you must activate
the App. Toggle the Status to Active and Save. Logout and Log back in, or
reload the browser page for the new activated integration to be recognized.
-
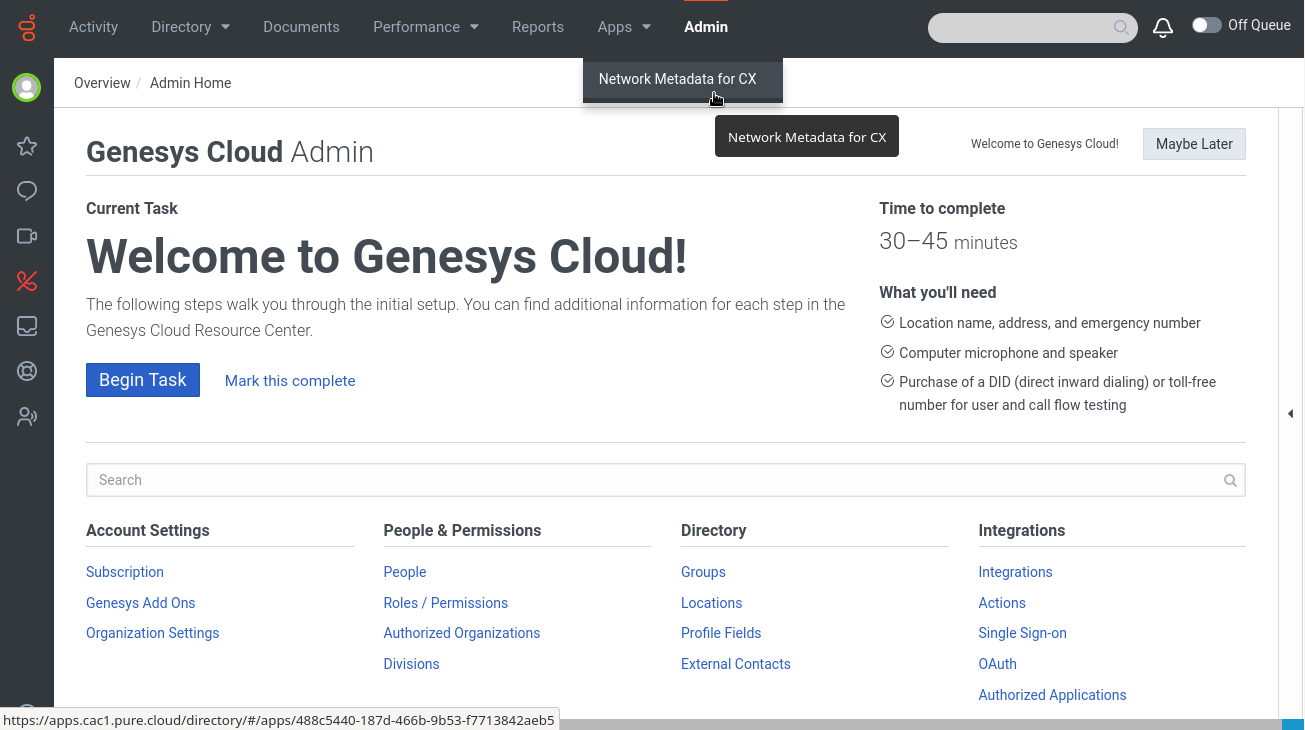
You should now be able to see the Network Metadata for CX entry in the
Apps
menu of your Genesys Desktop.
-
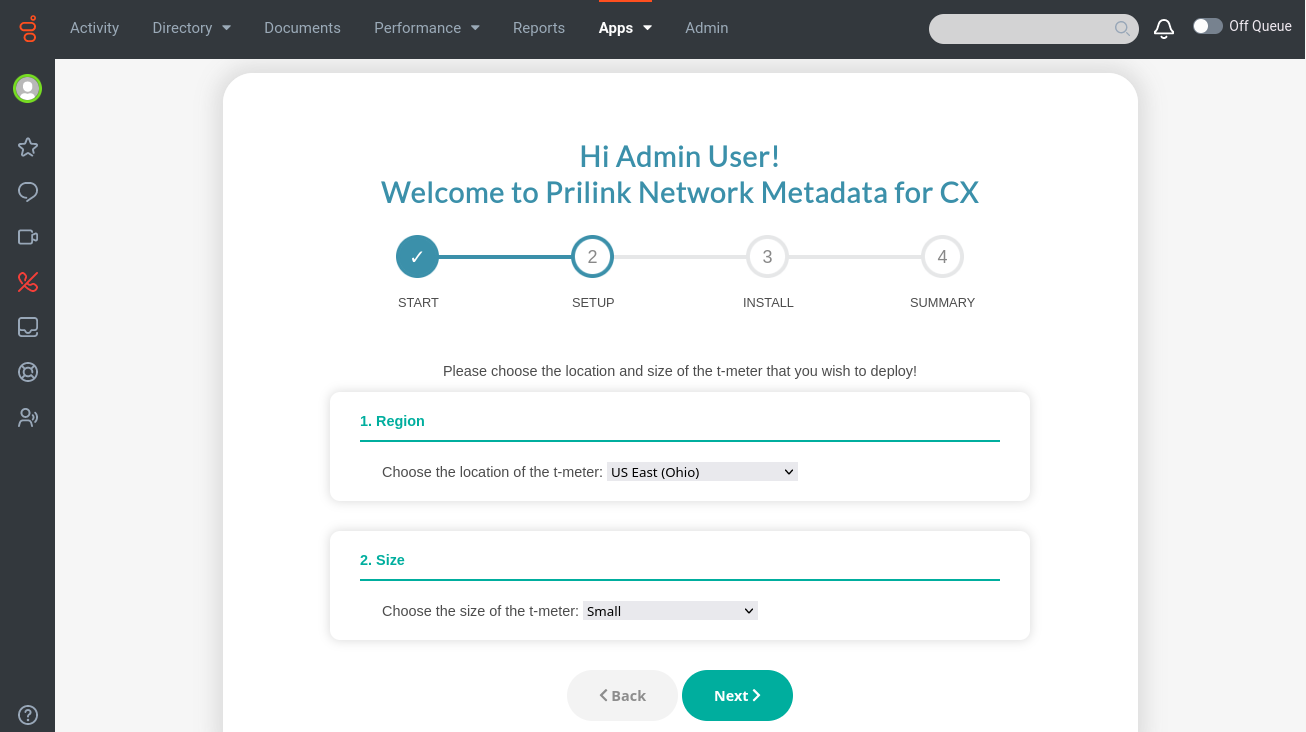
Choose Network Metadata for CX from the Apps menu to launch the
installation wizard and follow on-screen instructions. Choose the region and size of the first t-meter that
you wish to deploy. Additional t-meters can be deployed at a later date.
-
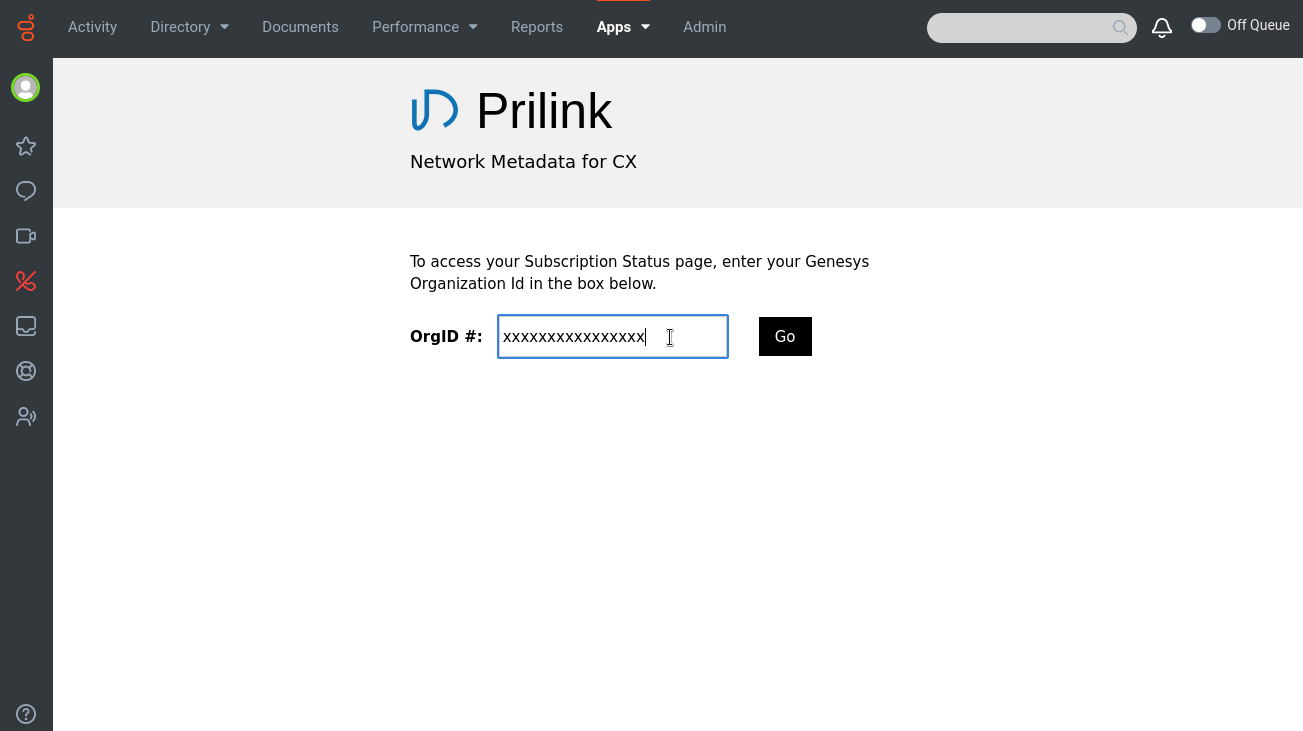
Once installation is complete, the wizard will now redirect you to the App landing page, where you will be
prompted to enter your Genesys Organization ID.
2. Accessing Network Metadata for CX
The NMCX App can be accessed from the Apps menu in your Genesys Desktop. This will direct you to the App landing page, where you will be prompted to enter your Genesys Organization ID.
(Note: If you have just installed the app, it may take up to 5 minutes for the first t-meter to initialize and appear in the app status page).
-
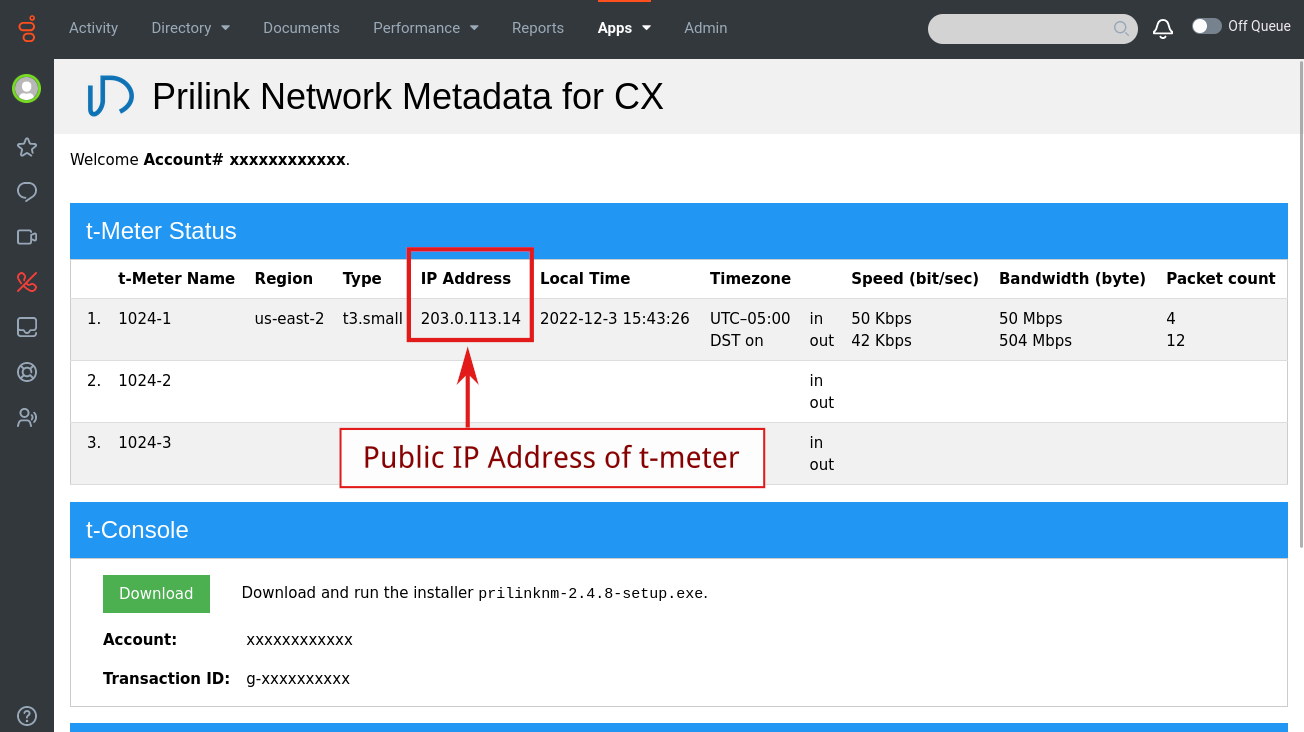
After entering your OrgID, you will be presenting with a status page showing realtime information for all
t-meters that have been deployed. An important piece of information to note is the IP address of each
t-meter, which will be required to setup your VXLAN Collector, as described later in this guide.
-
Also present on the status page is the download link for the t-console installer, and login information for
the t-quicksight dashboard.
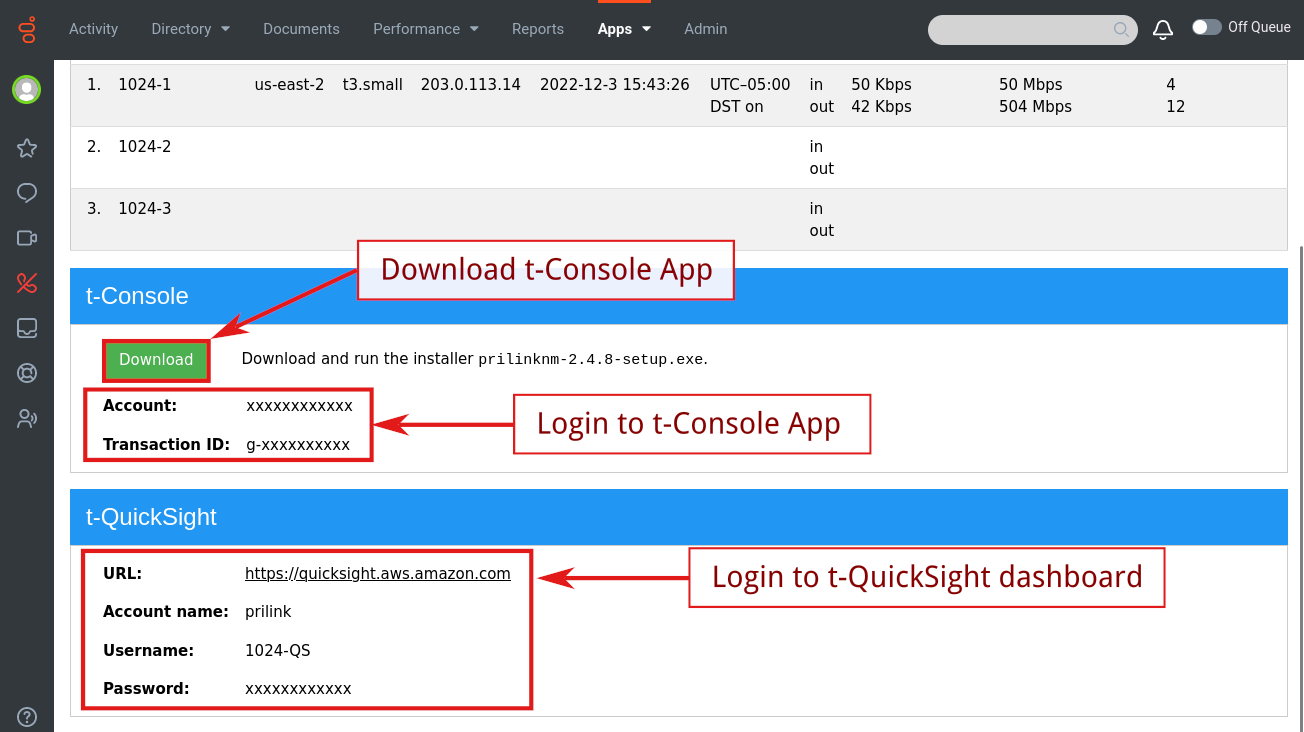
- When starting the t-console application, you will required to enter the Account number and Transaction ID shown below the t-console download link. See the t-console User Guide for detailed usage information.
3. Launching a VXLAN Collector in AWS
Now that a t-meter has been deployed and you are able to access the NMCX app, the next step is to launch a VXLAN collector. This device will accept mirrored network traffic, package it using VXLAN and send it to a t-meter for analysis.
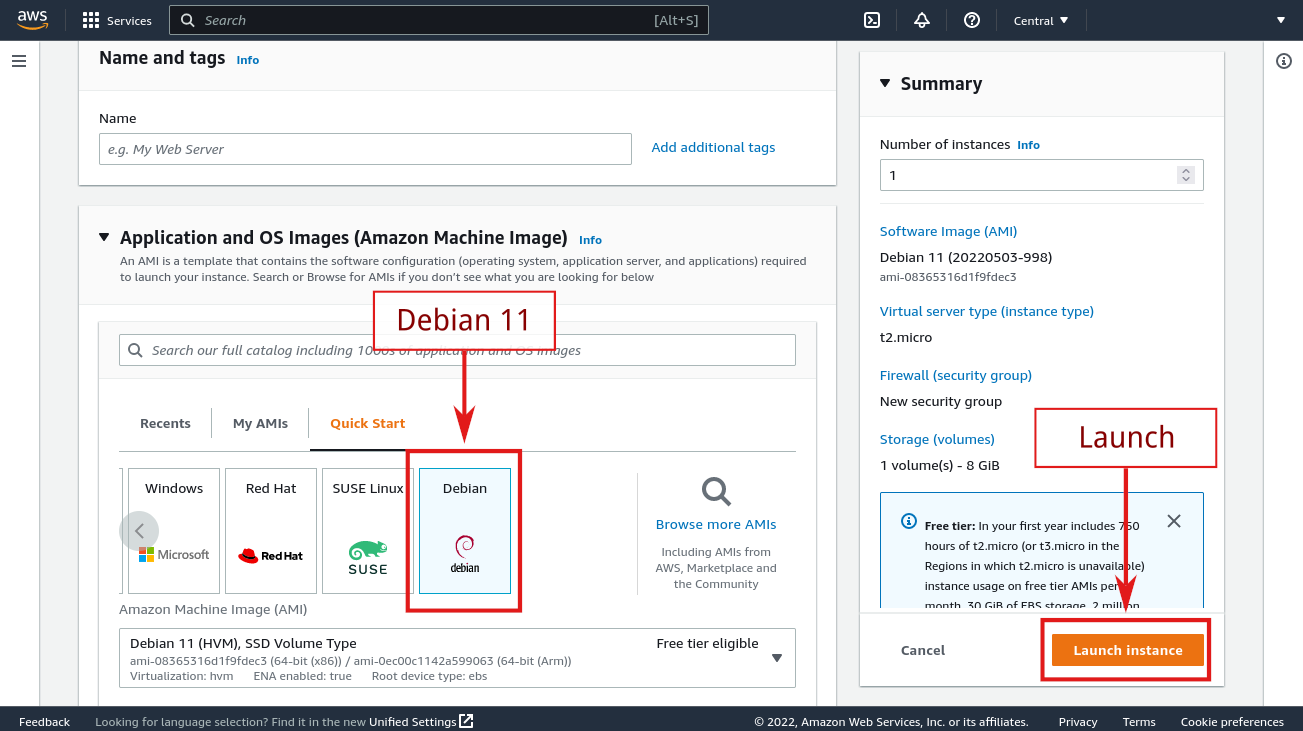
- Open the Amazon EC2 console at https://console.aws.amazon.com/ec2/. From the EC2 console dashboard, choose Launch instance.
-
Select Debian 11 OS image and choose an instance type (we suggest c5n.large). Make sure to launch the instance in a VPC that has access to public internet, and choose a security group that allows all outbound traffic to be sent to the public IP address of the t-meter.
- Once the Debian 11 instance is running, connect to it using an SSH client (see Connect to your Linux instance for details).
-
Consult our VXLAN Collector repository and
download the
vxlan-setupscript, which will configure the Debian 11 instance to function as a VXLAN Collector. Run the script and pass it the public IP address of the t-meter as an argument. (The public IP address is obtained from NMCX status page, as described above).Debian GNU/Linux comes with ABSOLUTELY NO WARRANTY, to the extent permitted by applicable law. admin@ip-x-x-x-x:~$ curl -O https://raw.githubusercontent.com/PrilinkLtd/VXLAN-Collector/main/vxlan-setup.sh % Total % Received % Xferd Average Speed Time Time Time Current Dload Upload Total Spent Left Speed 100 1713 100 1713 0 0 8118 0 --:--:-- --:--:-- --:--:-- 8080 admin@ip-x-x-x-x:~$ chmod +x vxlan-setup.sh admin@ip-x-x-x-x:~$ sudo ./vxlan-setup.sh 203.0.113.14 Setting up VXLAN: remote IP 203.0.113.14 VXLAN setup complete. Reboot. admin@ip-x-x-x-x:~$ sudo reboot
After reboot, VXLAN collector setup is complete.
Any traffic sent to the network interface of the VXLAN Collector will now be forwarded through a VXLAN tunnel to the specified t-meter for analysis.
4. Setting up AWS Traffic Mirroring
Once a VXLAN Collector has been deployed, the final step is to mirror traffic from your cloud servers to the VXLAN collector, where it will in turn be forwarded to the t-meter.
Suppose you wish to analyze the traffic from an EC2 instance running in AWS (labelled EC2 Instance in the diagram below).

The following instructions will show how to create the traffic mirror sessions shown above between the EC2 instance and your VXLAN collector. There are two separate mirror sessions created; one for inbound traffic, and the other for outbound traffic. The reason for splitting inbound/outbound into separate mirror sessions, is that each session can be assigned a unique VXLAN network identifier (VNI), which makes it possible for the t-meter to determine the direction of each packet analyzed.
-
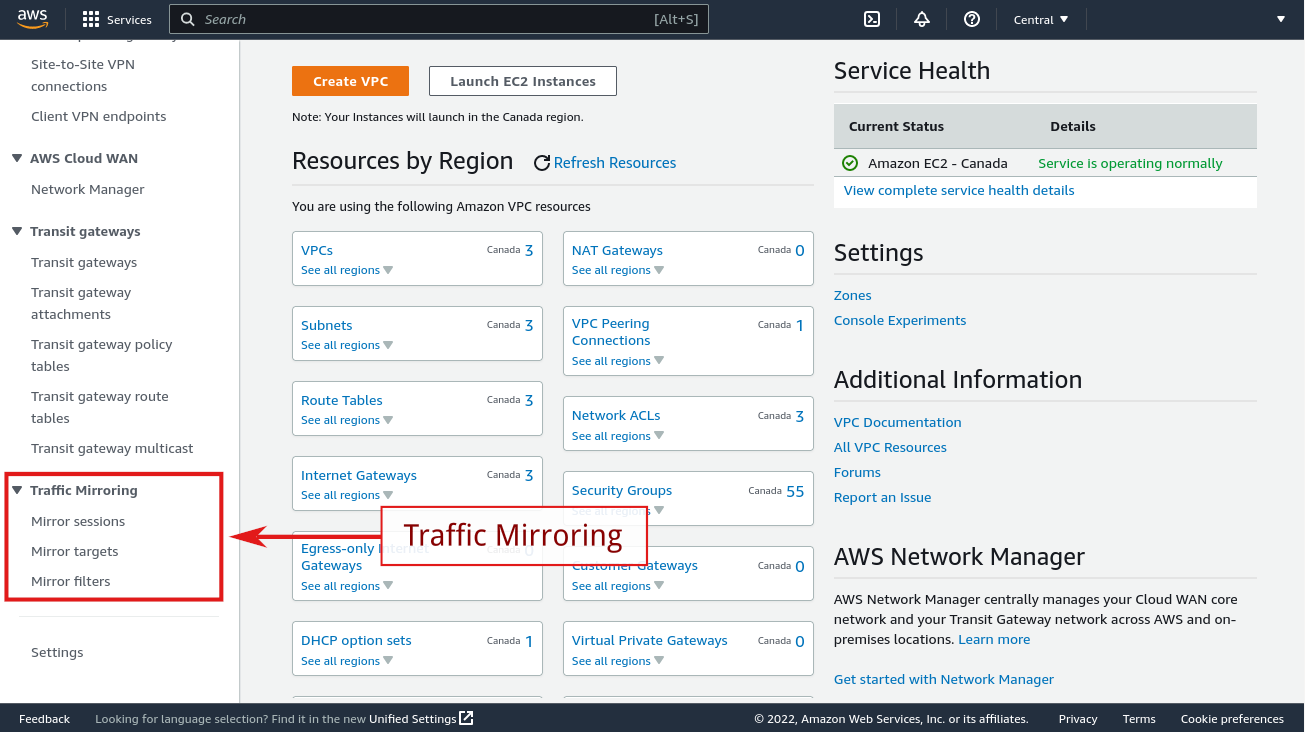
Open the Amazon VPC console at https://console.aws.amazon.com/vpc/. From the VPC console
dashboard, select Mirror Targets under Traffic Mirroring.
-
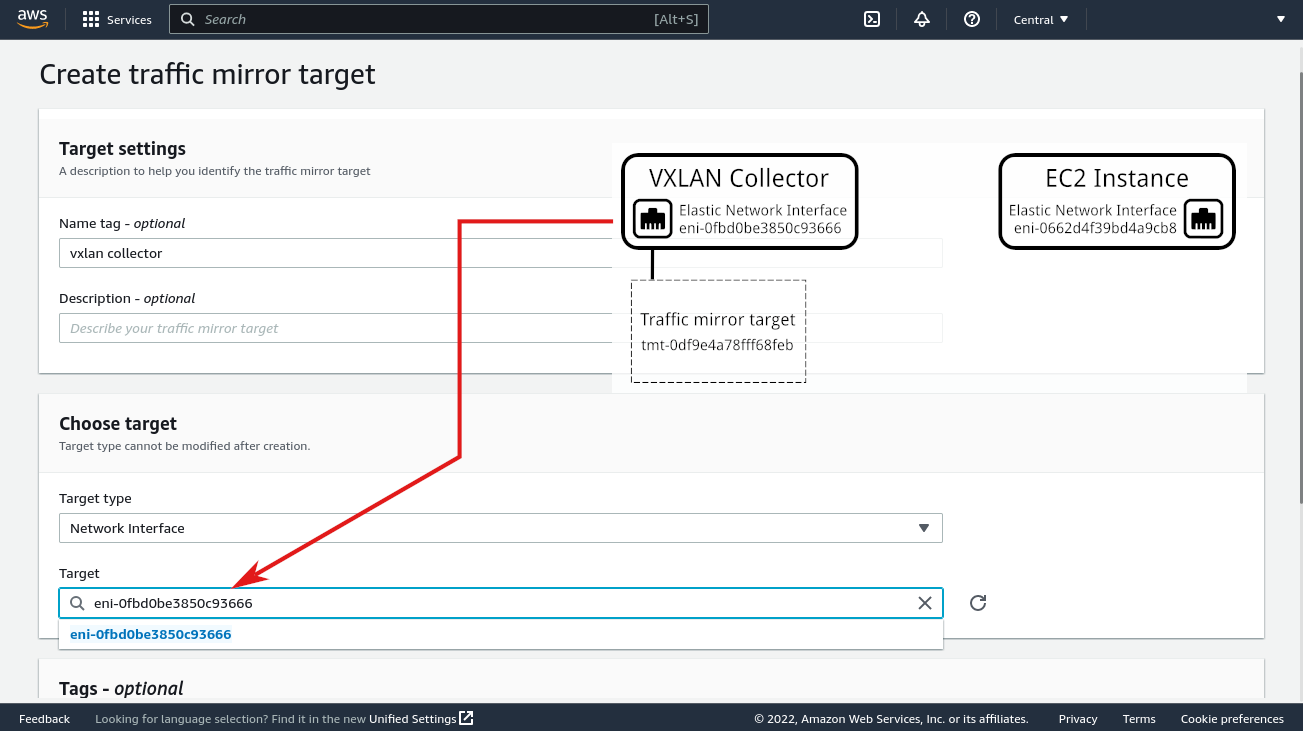
Click Create traffic mirror target and create a traffic mirror target using the network
interface of the VXLAN collector.
-
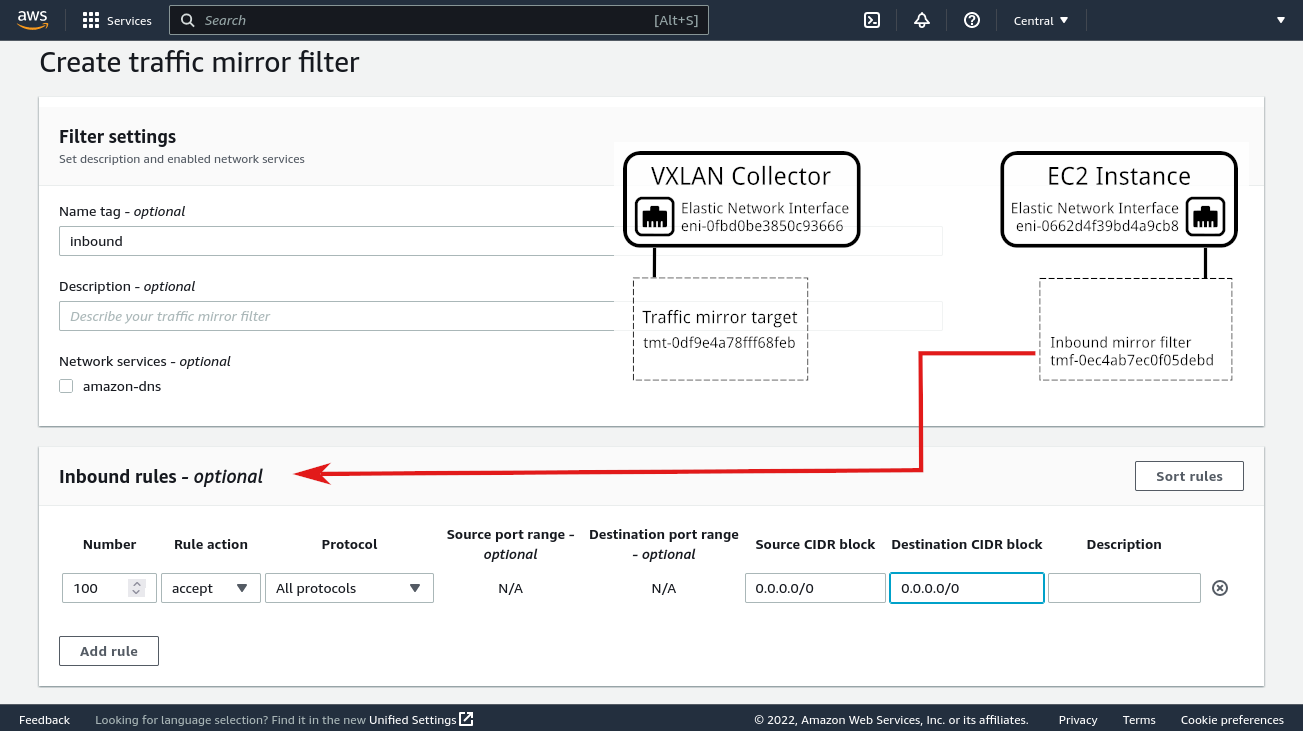
Select Mirror Filters under Traffic Mirroring. Click Create
traffic mirror filter and create a traffic mirror filter with a single inbound rule that
accepts all inbound traffic.
-
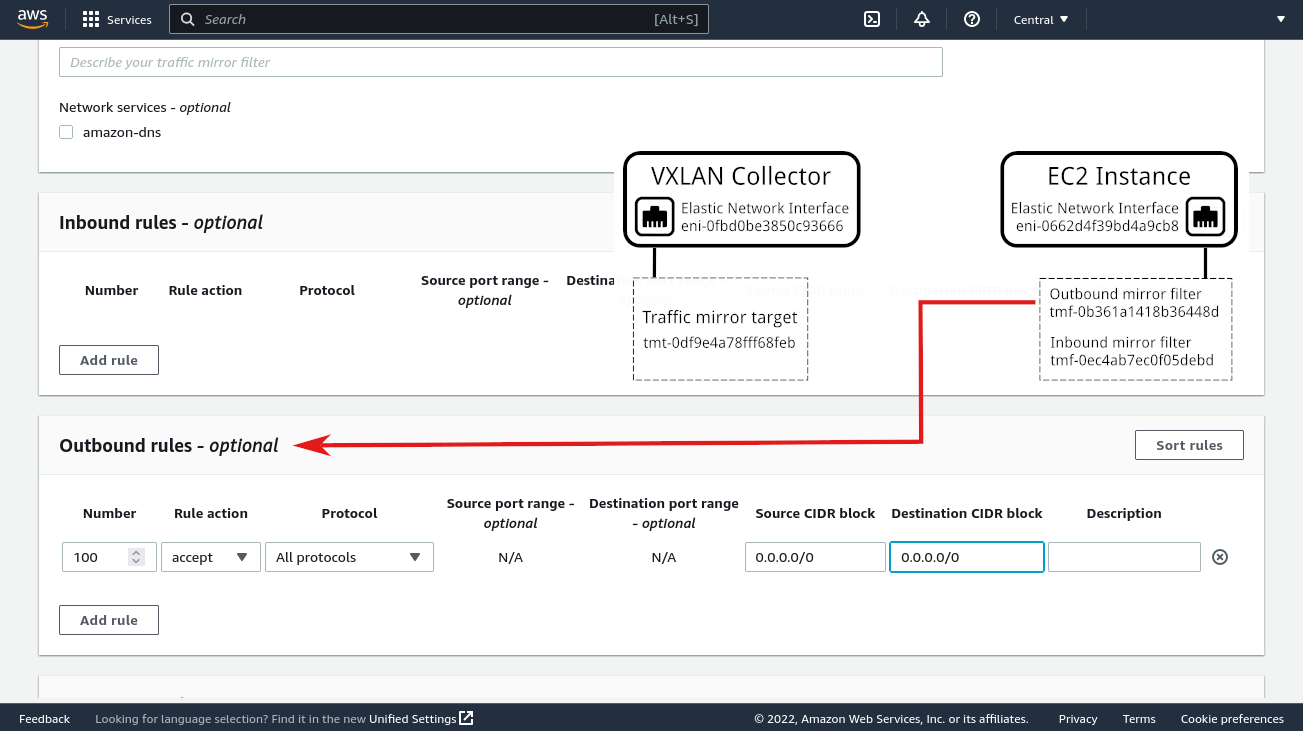
Create another traffic mirror filter with a single outbound rule that accepts all outbound traffic.
-
Select Mirror Sessions under Traffic Mirroring. Click Create traffic
mirror session and create a traffic mirror session using the network interface of the EC2 instance as a
source. For target, specify the traffic mirror target created in step 2.
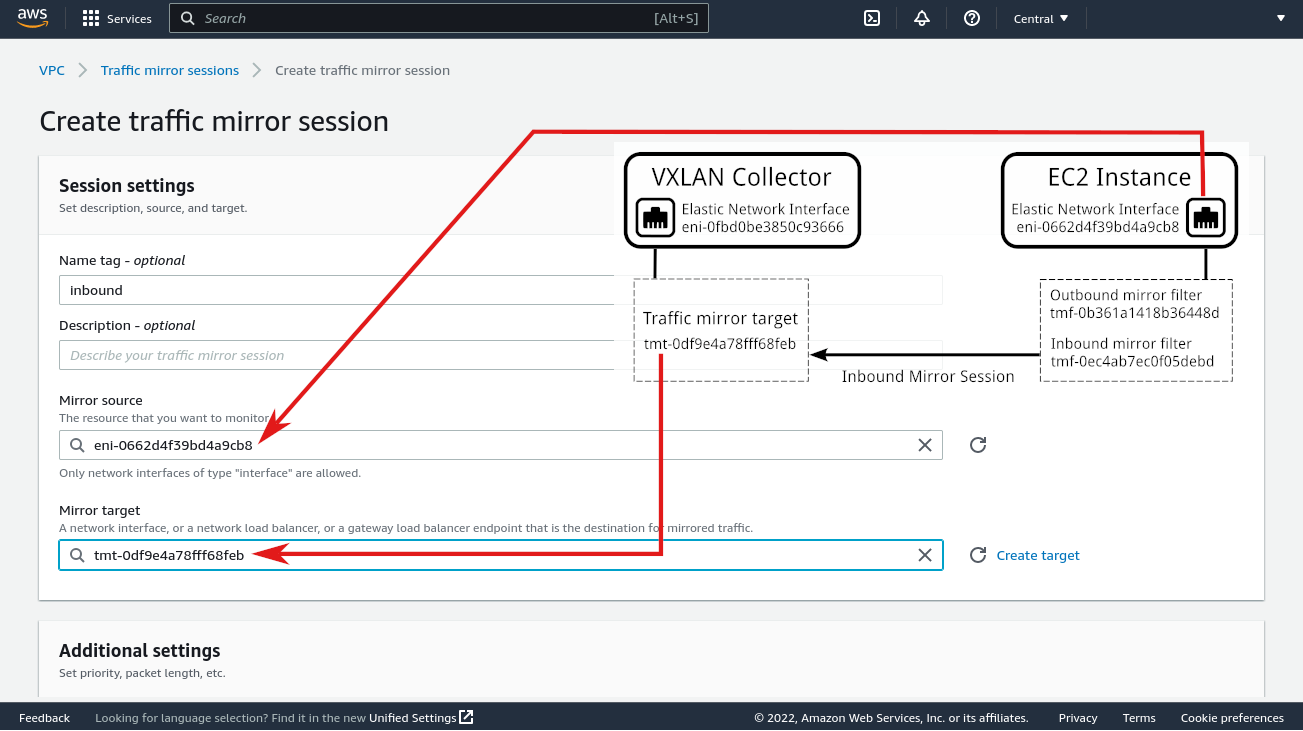
Under Additional settings, set VNI to 1024, and set the filter to the inbound mirror filter created in step 3.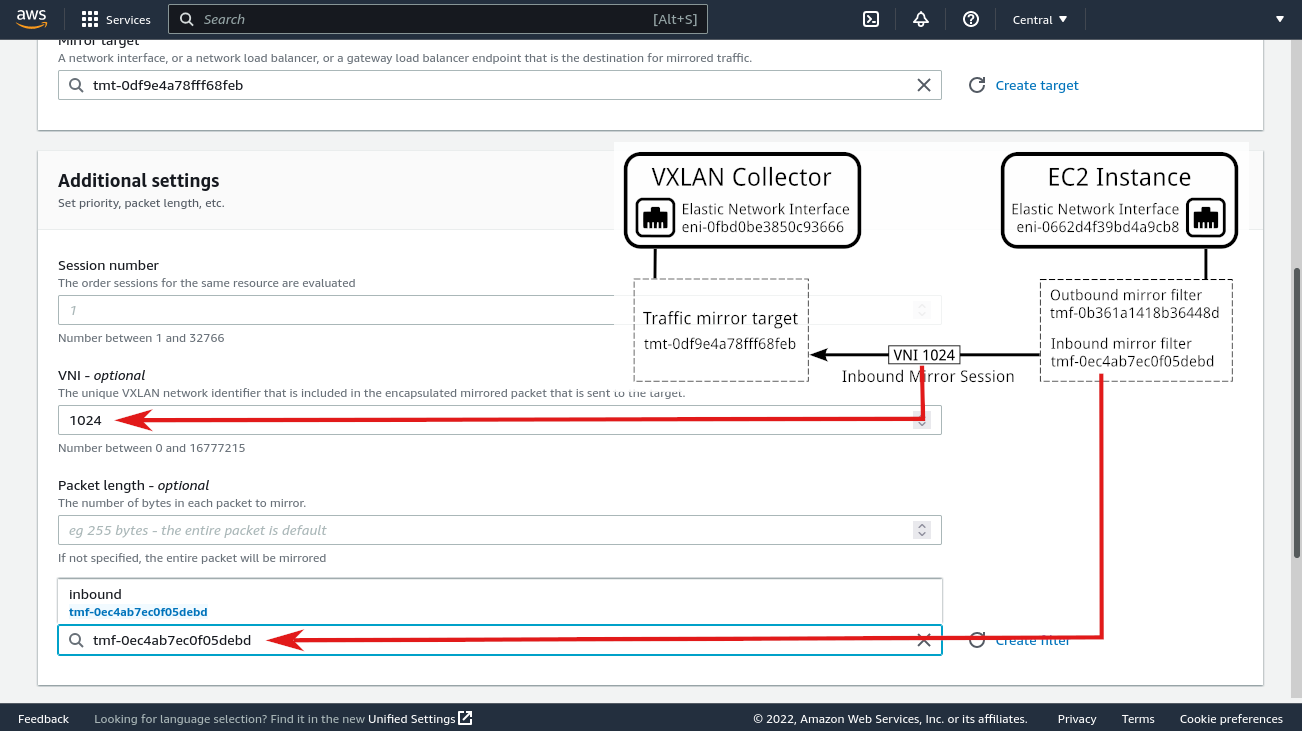
-
Repeat the previous step to create another traffic mirror session using the same source and target, but this
time for outbound traffic. Under Additional settings, set VNI to 1025, and
set the filter to the outbound mirror filter created in step 4.
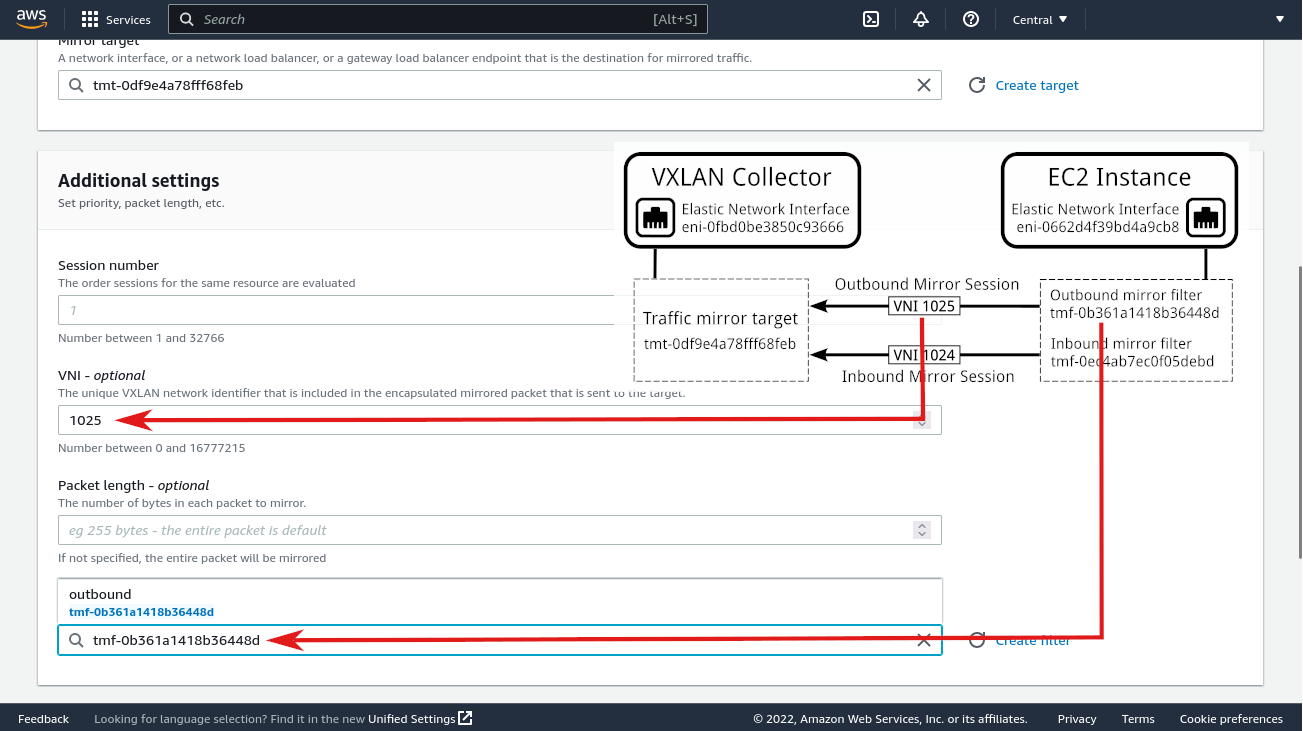
AWS Traffic Mirroring setup is now complete. All traffic from your cloud server (EC2 instance) will be mirrored to the VLXAN collector in two separate mirror sessions (one for inbound, and one for outbound). The VXLAN collector will in turn forward this traffic to a t-meter, where it will be analyzed and displayed in the t-console app and t-quicksight dashboard.
(*) Non-AWS Deployment Scenarios
Other Cloud providers:
- Google Cloud Platform: A VXLAN Collector can be created by launching a Debian 11 instance, and utilizing the
same
vxlan-setupscript as in AWS. In addition, Google Packet Mirroring can be used in place of AWS Traffic Mirroring. - Microsoft Azure: A VXLAN Collector can be created within a Windows Server with the use of Microsoft Hyper‑V.
For on-premise scenarios, a VXLAN collector can be deployed as a physical server which connects to the mirror ports of edge-routers or switches.
Please contact Prilink to discuss further details about non-AWS deployment scenarios for NMCX.
